Around the world - visualization of ship logbooks from the 18th and 19th centuries
First things first:
/assets/daft-punk-around-the-world.mp3?loop=1
This post is an attempt to visualize the travels of ships from the 1700s and 1800s, based on their own journey logs. The data that I used came from the CLIWOC project, a very interesting EU-funded project that created a climatological database based on logged weather observations from ships going around the world around this time. We’ll disregard the climate part of this completely and focus on what I find more interesting, mapping the ships’ travels as a way to broaden our historical understanding of these times.
Visualizing these travels was also a way for me to learn about data visualization techniques, specifically how to plot geographical data.
An overview of the dataset is available here. In a nutshell, it includes multiple logbook-style observations from ships that were sailing roughly between 1750 and 1850; each observation includes position data, which will be our primary focus, as well as other very interesting data such as ship nationality, departure and destination cities and notes on cargo being transported.
In total there are 280280 logged observations, 246214 after removing duplicates - entries for the same ship on the same day - and those without a VoyageIni field. Of those, 9.5% don’t have latitude or longitude measurements, and a few of them are also missing either departure or destination place, so cleaning for those leaves us with 226441 total observations from 4339 unique journeys.
The earliest journey available on record started on 15 january 1662, and the very latest one on 21 january 1855. The dataset includes logs from ships of 8 different nationalities, in the following proportion:
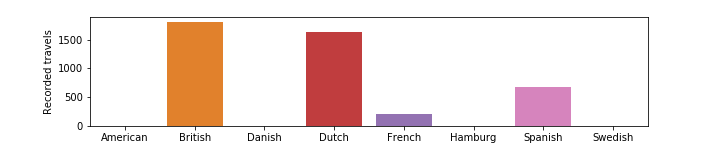
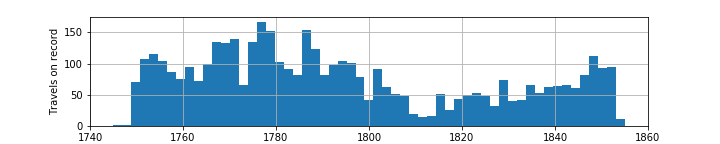
There are a large number of logged travels per year until around 1800 followed by a sharp drop and slow climb back to pre-1800 levels. It’s hard to say whether this is a reflection of the historical context - were there really less ships active around this time? - or merely the result of lack of data, either because logs from that time didn’t survive to make it into this database or sailors decided to stop keeping logs for a while. But given that this steep decrease in active ships comes during the time of the Napoleon wars, where the 4 main sources of our logs - british, dutch, spanish and french - were heavily involved, it does seem to make sense that there would have been an actual policy shift resulting in less sea activity.
Of course this dataset has a few problems - I find it incredible that it even exists, to be honest - that we should keep in mind. Three are worth pointing out:
- Latitude and longitude values are determined by multiple methods depending on the original records and will not always be very accurate. We always use the Lat3 and Lon3 columns, described as those “derived from the best position available”, but make no distinction between how those values were arrived at.
- Free-form fields such as CargoMemo, WarsAndFightsMemo etc are usually empty. In the particular case of the CargoMemo field, there are only entries from dutch logs (and a single funny british one).
- Locations usually have hard-to-recognize names, either because they’re written in foreign-language form or they’re historical names no longer in use. This is not really a problem, just means that we have to search a bit to find what on earth Batavia is.
Ports of the world
A first interesting look at this is to map all places referenced in these logs, available in the Geodata table.
A good first sign is that most places are on the coastline, so the coordinates data makes some sense. There’s still a couple of gems such as the North Cape of Maquilon in western Kazakhstan or the Island of Goree deep in the sahara desert, but overall most places look reasonable. Also note that some names are in the language of whoever wrote the log entry, resulting in unfamiliar spellings such as Narwick (Narvik, Norway), Doodkist van Sedaijo (Sedayu, Indonesia) or - my personal favourite - Cape Spitchell.
Since the dataset is dominated by British logs, most of these places are located in areas of british influence, either commercial or military - notably the north american east coast and the indian peninsula. There’s also a bit of a cluster around modern-day Indonesia (sprinkled with weird dutch names) and around the african west coast - and close to nothing going on in Japan, mainland China and the mediterranean. And then some dots in the middle of the ocean close to where we expect them to be, such as Tristan da Cunha and Ile de Pasque.
Overall, not a completely unreasonable picture of where we’d expect ships with these affiliations to be spending their time while on shore. Let’s move on and have a look at where they spent their time at sea.
Mapping a random journey
And by random I mean the first one in my dataset, which, since it is ordered alphabetically, belongs to ship ’s-Gravenhage of the dutch republic. Congratulations!
This is actually a reasonably thorough log - the journey took 93 days and there are 92 log entries, as they skipped the day before arriving in Batavia (which is why it looks like they went through the island). In fact it probably took 2 or 3 extra days since the first log entry is noted close to Exeter rather than the Netherlands.
There are 2 logged journeys for this ship - this one, from “Nederland” to Batavia (modern-day Jakarta, Indonesia), and another one from Batavia to Brouwershaven started shortly after this one ended - which makes it seems like it was on a return journey of some kind, probably a trading mission. It also makes it reasonable to assume that they took off from Brouwershaven, even though logs start in the middle of the ocean. ‘s-Gravenhage, by the way, is apparently the proper name of the dutch city of The Hague, so brace for some cluttered search results if you try to find out more about the ship itself.
Here’s the same map including the return journey:
At this point I feel it would be interesting to dive a bit more into this particular ship’s historical context, but it’s hard to gather much from our dataset. There are only these 2 recorded journeys, spanning just under 1 year. Some additional pieces of information:
-
the ship belonged to a company called MER - not the dutch east india company (VOC) as I expected. Unfortunately I could not easily find any information on what this MER company was.
-
the captain was the same in both trips and went by the name C.J. Blok.
-
there is no information in the “Cargo” and “CargoMemo”, which for other ships provides interesting information such as “haalden 7 hele en 5 halve varkens water” (“7 whole and 5 half pigs got water”, according to google translate), “Found in the Spirit room and coal room a pipe of wine and 3 Puncheons of rum store in the hurricane”, or “242 slaven”.
-
the WarsAndFights column disappointingly adds up to 0, so there doesn’t seem to have been much going on except trading.
-
it anchored in St. Helena on 18-3-1848, on the return journey.
-
the original data came from the Koninklijk Nederlands Meteorologisch Instituut, in De Bilt.
Oh well. Moving on.
Mapping multiple journeys
This dataset is dominated by british, spanish, dutch and french ships, but there are some observations from other powerhouses of the time - danes, swedes, americans and hamburgers. It’s interesting to see their travels grouped together:
Note the different time periods - swedish travels date from around 1750, while the others are around the turn of the century (and a bit later for the americans). In any case it’s interesting to see that sweden was hanging out around the indian ocean and south-east asia for a while during their enlightenment period.
One of the most interesting uses of this data is getting a sense of what the seas looked like around this time. We can do that by mapping ship positions at certain moments. Here are a few interesting snapshots:
This is a watered-down version of how the seas looked like in 1755 (actually, these are all journeys started in 1755). We can easily identify some familiar colonial routes: french ships going to modern-day Canada, dutch ships going to slave trade hotspots in west africa and the caribbean, and british ships being all over the place, especially north america and india, with one recorded journey by Princess Augusta between hong kong and singapore. There don’t seem to be any records of spanish ships, but it’s a safe bet they were around there somewhere.
Fast-forward to 1790 and we have a very different picture of the oceans:
British ships are nowhere to be seen near the american coast (understandably, as they had just come off losing the american war of independence) and seem instead to have turned their focus to the west indies. So have the dutch though, so that probably resulted in some conflicts that no one bothered to keep track of - which is maybe why they played it safe and took a few trips to Greenland and the Svalbard, just in case one could actually live there.
Meanwhile Spain seems to be reaping the benefits of helping out in the american war and has the strongest presence in the north atlantic ocean, mostly with its outposts in Florida and the caribbean, all the while continuing their travels to south america - with one very interesting journey across the magellian strait and all the way to Lima, Peru. The french also seem to have something going on with their caribbean outposts. All in all it seems that in 1790 the seas were fairly disputed and british dominance was far from established.
Let’s dive into the situation in 1809-1810. Recall that around this time Europe was grappling with Napoleon’s french empire, and specifically that in 1810 the kingdom of Holland was annexed into France. How did that affect the situation in the seas?
Right, not much dutch going on, aside from a lonely journey from the caribbean into the indian ocean. In fact, aside from spain’s trademark journeys to argentina and a single french voyage to the east indies, we only have records of british ships on their trade missions with indian ocean territories.
It seems reasonable to assume the Napoleon wars had a dampening effect on sea activities, as essentially all of europe had to focus on the continental war. But it is still impressive to see that, despite that, british trade to india remained active during that time, which gives some indication of how important those resources were to their economy.
Finally, let’s look at the situation in 1848.
It is staggering to see how the dutch position changed over less than 40 years - they now seem to have a much tighter integration with the east indies, which by now were an integral part of the dutch empire. Their presence in the caribbean also looks stronger than before.
Meanwhile, there are no records of british ships, which is strange since we know they were brewing a strong presence in south africa, the indian subcontinent and australia. So this likely means that we lack any records of those activities. Sad.
Animated travels
One more thing left to cover, and that is - we want to see some animated travels, goddamit! Alright fine. But be patient, they take a bit to react.
Here are sweden’s travels in real time:
And all travels on record to New Zealand:
And british travels to India:
Just kidding, that would blow up the browser. Unfortunately I’m quite unskilled with web technologies and couldn’t find any way of showing this timelapses that wouldn’t become too heavy after just a few travels, which is why we only have these limited selections. But I could plot any one journey like this, which can be pretty cool if that journey has some special significance. Like the single trip on record to Easter Island, from Talcaguana (close to modern-day Concepción, Chile):
Finally, let’s see if we can use this data to shed some light on two historical events we’re reasonably familiar with, the atlantic slave trade and the american war of independence.
Atlantic slave trade
The atlantic slave trade was flourishing around the time of these travels, so I would expect the “CargoMemo” field of our observations to frequently include slaves. However, only for dutch ships is this CargoMemo field not empty, which means we only get a limited view on the slave trade happening at the time. This is what the travels including “slaven” as its cargo look like:
We can see that all this trade is coming from west africa towards the parts of the americas colonised by the dutch, notably Guyana, Suriname and the Netherlands Antilles. Overall there are only 10 registered voyages with slaves as cargo, and it is a shame we cannot get any insights into other nation’s slave trading activities from this dataset.
American war of independence
Another notable set of events that this dataset could provide some insights into is the 1775-1783 american war of independence. This involved most of the nations represented in the dataset, essentially British vs Americans, French, Dutch and Spanish, and featured a number of naval battles. So we should have plenty of records of those battles, or at least of the ships’ travels on their way to battle, right?
Unfortunately, not really. There are no records of american ships during this period, and french ships are merely travelling back and forth to the caribbean, with the exception of La Pintade which was sent to the american east coast in 1783 and presumably played some role in the final stages of the war (it only returned to France after the Treaty of Paris, ending the war, had been signed).
We do have some more data on spanish and british ships, although it’s hard to say which were actually involved in the war. None made any note of that, at least none that arrived at our “WarsAndFightsMemo” column. Still, we can get a snapshot of what the peak stages of the war looked like on the seas:
Interestingly, there seems to be a greater frenzy on the iberian coast, probably about Gibraltar, than on the american east coast.
The one ship we can identify as having played a role in the war is the british HMS Montague, which took part in the Battle of the Chesapeake on 5 september 1781. Although it has no records between 27 august and 12 september, and what records it has show no mention of conflicts, it was located around the chesapeake bay area before and after that time, and it is listed as part of the british fleet that took part in the battle.
Summary
The pre-tweet for this project was:
“Based on kaggle’s ocean ship logs dataset I mapped the ships’ positions over time.”
The post-tweet could be the same, so mission accomplished! And I managed to add some interactivity as well via the plotly interface and the timelapse slider, which I think makes for a bit more fruitful exploration.
I came up a bit short in terms of map interactivity, and that’s something to explore further in the future. Some issues i ran into:
-
loading time: this approach means a huge html file, probably not a great idea. That is mostly a result of the multiple frames for the timelapse plots being included in the html, and then selected in the figure. One way around that is to just generate the figures on the spot rather than including all of them - the newest plotly version seems to be able to do that already, so that could be one way of doing it. Or the british could have a bit less ships poking around.
-
dashboarding: I briefly tried to use Dash to set up a user dashboard but that fell through when I realized I would have to deploy an app and host it somewhere, which was not the point of this project. But it might be something to look into in the future.
-
alternative map plotting libraries: one of the goals of this project was to explore different mapping libraries in python and get a sense for which would work best, but just being able to do something with plotly took long enough - so I’ll have to leave this for the future. The most promising places to start seem to be holoviews and geopandas.
-
security: for this I had to use a mapbox token, which I would like to avoid in favour of some open source alternative like openstreetmaps. And because I’m a web-stuff noob, the token is just waiting to be fetched from the html. Please be nice.
In the end, it was nice to finally be able to plot this specific dataset, which I’ve had as a “to do soon” project for a long time. It’s also nice to have taken some first steps in map plotting and to now have an initial roadmap for this kind of explorations. And it was quite fun, and definitely enlightening, to look at this time in history through a data-oriented lens.
Appendix - embedding audio into post
I thought it was fitting to set daft punk’s around the world as the soundtrack to this post, and that cost me 2 full pomodoros. Here’s how I did it in the end:
-
I implemented the open-embed plugin described here. Some notes on that:
-
added the plugin only on the “post” layout page. In general it might be useful to have it available in the “default” layout, but for now this is enough.
-
replaced the jquery source from src=”/js/jquery.min.js” to src=”https://ajax.googleapis.com/ajax/libs/jquery/1.11.3/jquery.min.js”, as suggested here (rdyar, 4-4-2018).
-
didn’t include the </body> and </html> tags in the layout file since those didn’t seem to make sense.
-
-
I got the mp3 file using youtube-dl, after some depressing minutes of looking into “mp3 download” search results. Placed the mp3 file in the assets folder.
-
I took a while to realize that I had to reference the root assets folder (“/assets/file.mp3”) rather than my first attempt “assets/file.mp3”, which attempted to find an assets folder in the post path (something like /2018/09/11/assets/file.mp3).
In the end the result is pretty neat: simply paste a link to something “.mp3” and open-embed will pick it up and transform it accordingly!
Two other options seemed reasonable:
- ashmaroli’s 5/4/2018 suggestion here. This seems like the proper way of doing it if this is something we want to do often.
- Adam Garret Harris’ suggestion in this post is easier to set up and also seemed like a good option for embedding video, although I couldn’t adapt it easily for audio only and it doesn’t seem to add anything once open-embed is in place.